
Every vendor in this category eventually gets the same enterprise question. "You want me to put a sensor on every edge location and feed my traffic signals back to your central service so you can correlate threats across my fleet. How is that different from giving you a man-in-the-middle on every request I serve?"
It's a fair question. Most of the industry's answer is a pile of contracts and a SOC 2 report. Trust us. Send us the data. We'll only look when we have to.
I wanted a different answer, because I didn't want to be in the position of asking for that trust in the first place.
Synapse Fleet Intelligence is the coordination plane for a fleet of Synapse sensors. It does the things you'd expect a fleet-management platform to do: a live threat map, campaign correlation, rule distribution, fleet health, analyst tooling, incident collaboration. But the design point that actually matters is the one most people don't ask about until the compliance review. It correlates threats across tenants without ever centralizing what any tenant's traffic contains. It shares fingerprints, not data.
This article is about how that works, why it matters to enterprise buyers, and what it buys you operationally when you're running thirty sensors — or three hundred.
One brain catches an attack. A fleet catches a campaign.
The companion piece to this one (Every sensor is a brain) makes the case that Synapse's unit is a complete detection engine. Pattern matching, behavioral analysis, schema learning, DLP, fingerprinting, session tracking, campaign correlation within a sensor — all local, in 25MB of Rust running on Pingora, behind a ~75μs WAF decision budget. No cloud round-trip. No network dependency.
That's the claim I started with, and I still believe it. But the claim has an obvious limit.
One sensor's detection helps one site. When a new attack pattern lands on your ecommerce edge, your marketing-site edge doesn't know about it yet. When a credential-stuffing campaign hits three of your tenants in a fifteen-minute window, none of the individual sensors see the coordination — they each see their local slice of noise. When an attacker rotates IPs across a /24, a single sensor is looking at three unrelated actors.
The enterprise reality of "many sensors" isn't a scale problem, exactly. It's a topology problem. The attacks are correlated across sites even when the sensors aren't.
Fleet Intelligence is what closes that loop. And the design question I had to answer first was whether closing it required me to know what your traffic contained. The answer turned out to be no.
Fleet Intelligence, concretely
Before the architectural argument, the actual surfaces.
Fleet Intelligence is the SOC and fleet-ops layer above your Synapse deployment. It runs as a Node.js service on PostgreSQL (authoritative state) with ClickHouse as an optional analytical store, a React dashboard for operators, and a REST + WebSocket API for everything else. It's built to sit on your infrastructure — standalone binary, npm package, or Docker — and talk to sensors over authenticated WebSocket.
What it gives you, roughly in the order an operator touches it:
- Fleet Aggregator. Real-time unified view of sensor health — aggregated RPS, latency percentiles, CPU, memory, disk, connection count. Heartbeats on 30-second intervals, deduped into rolling 5-minute windows.
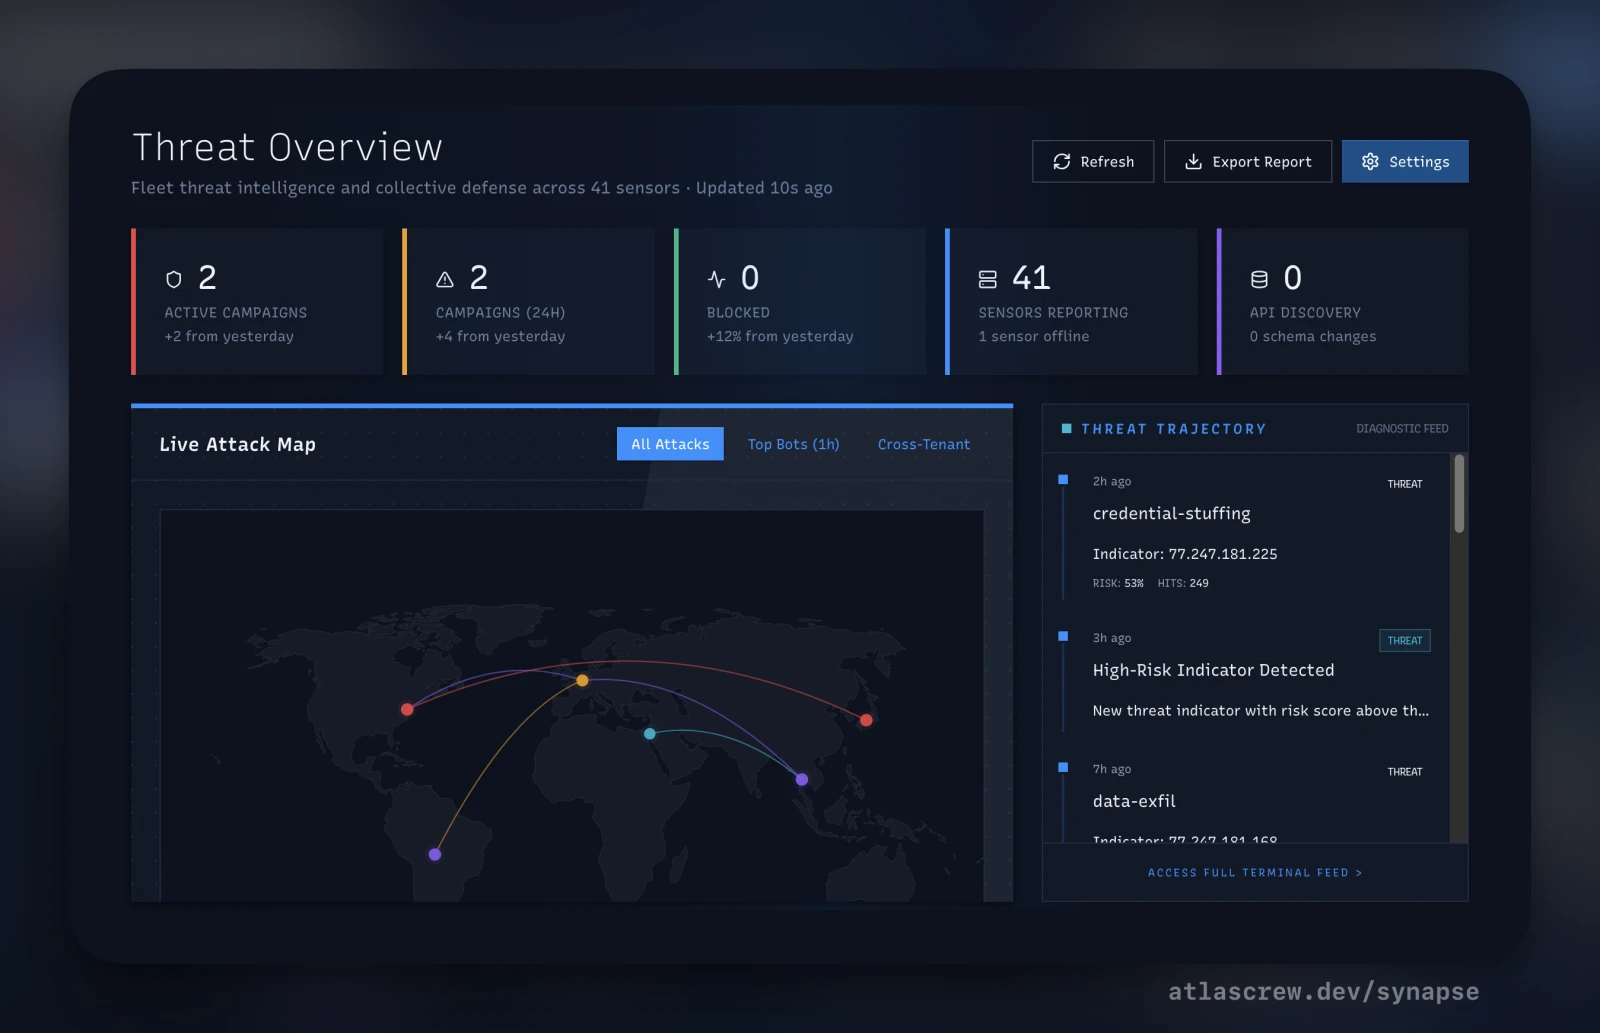
- Live Threat Map. Geo-IP visualization of real-time attack origins with drill-down. Useful for the war-story screen-share, better for the subconscious pattern-matching when the map tightens around a region.
- Active Campaigns. An 8-factor correlator identifying attack operations that span tenants and sensors — the things a single sensor can't see on its own.
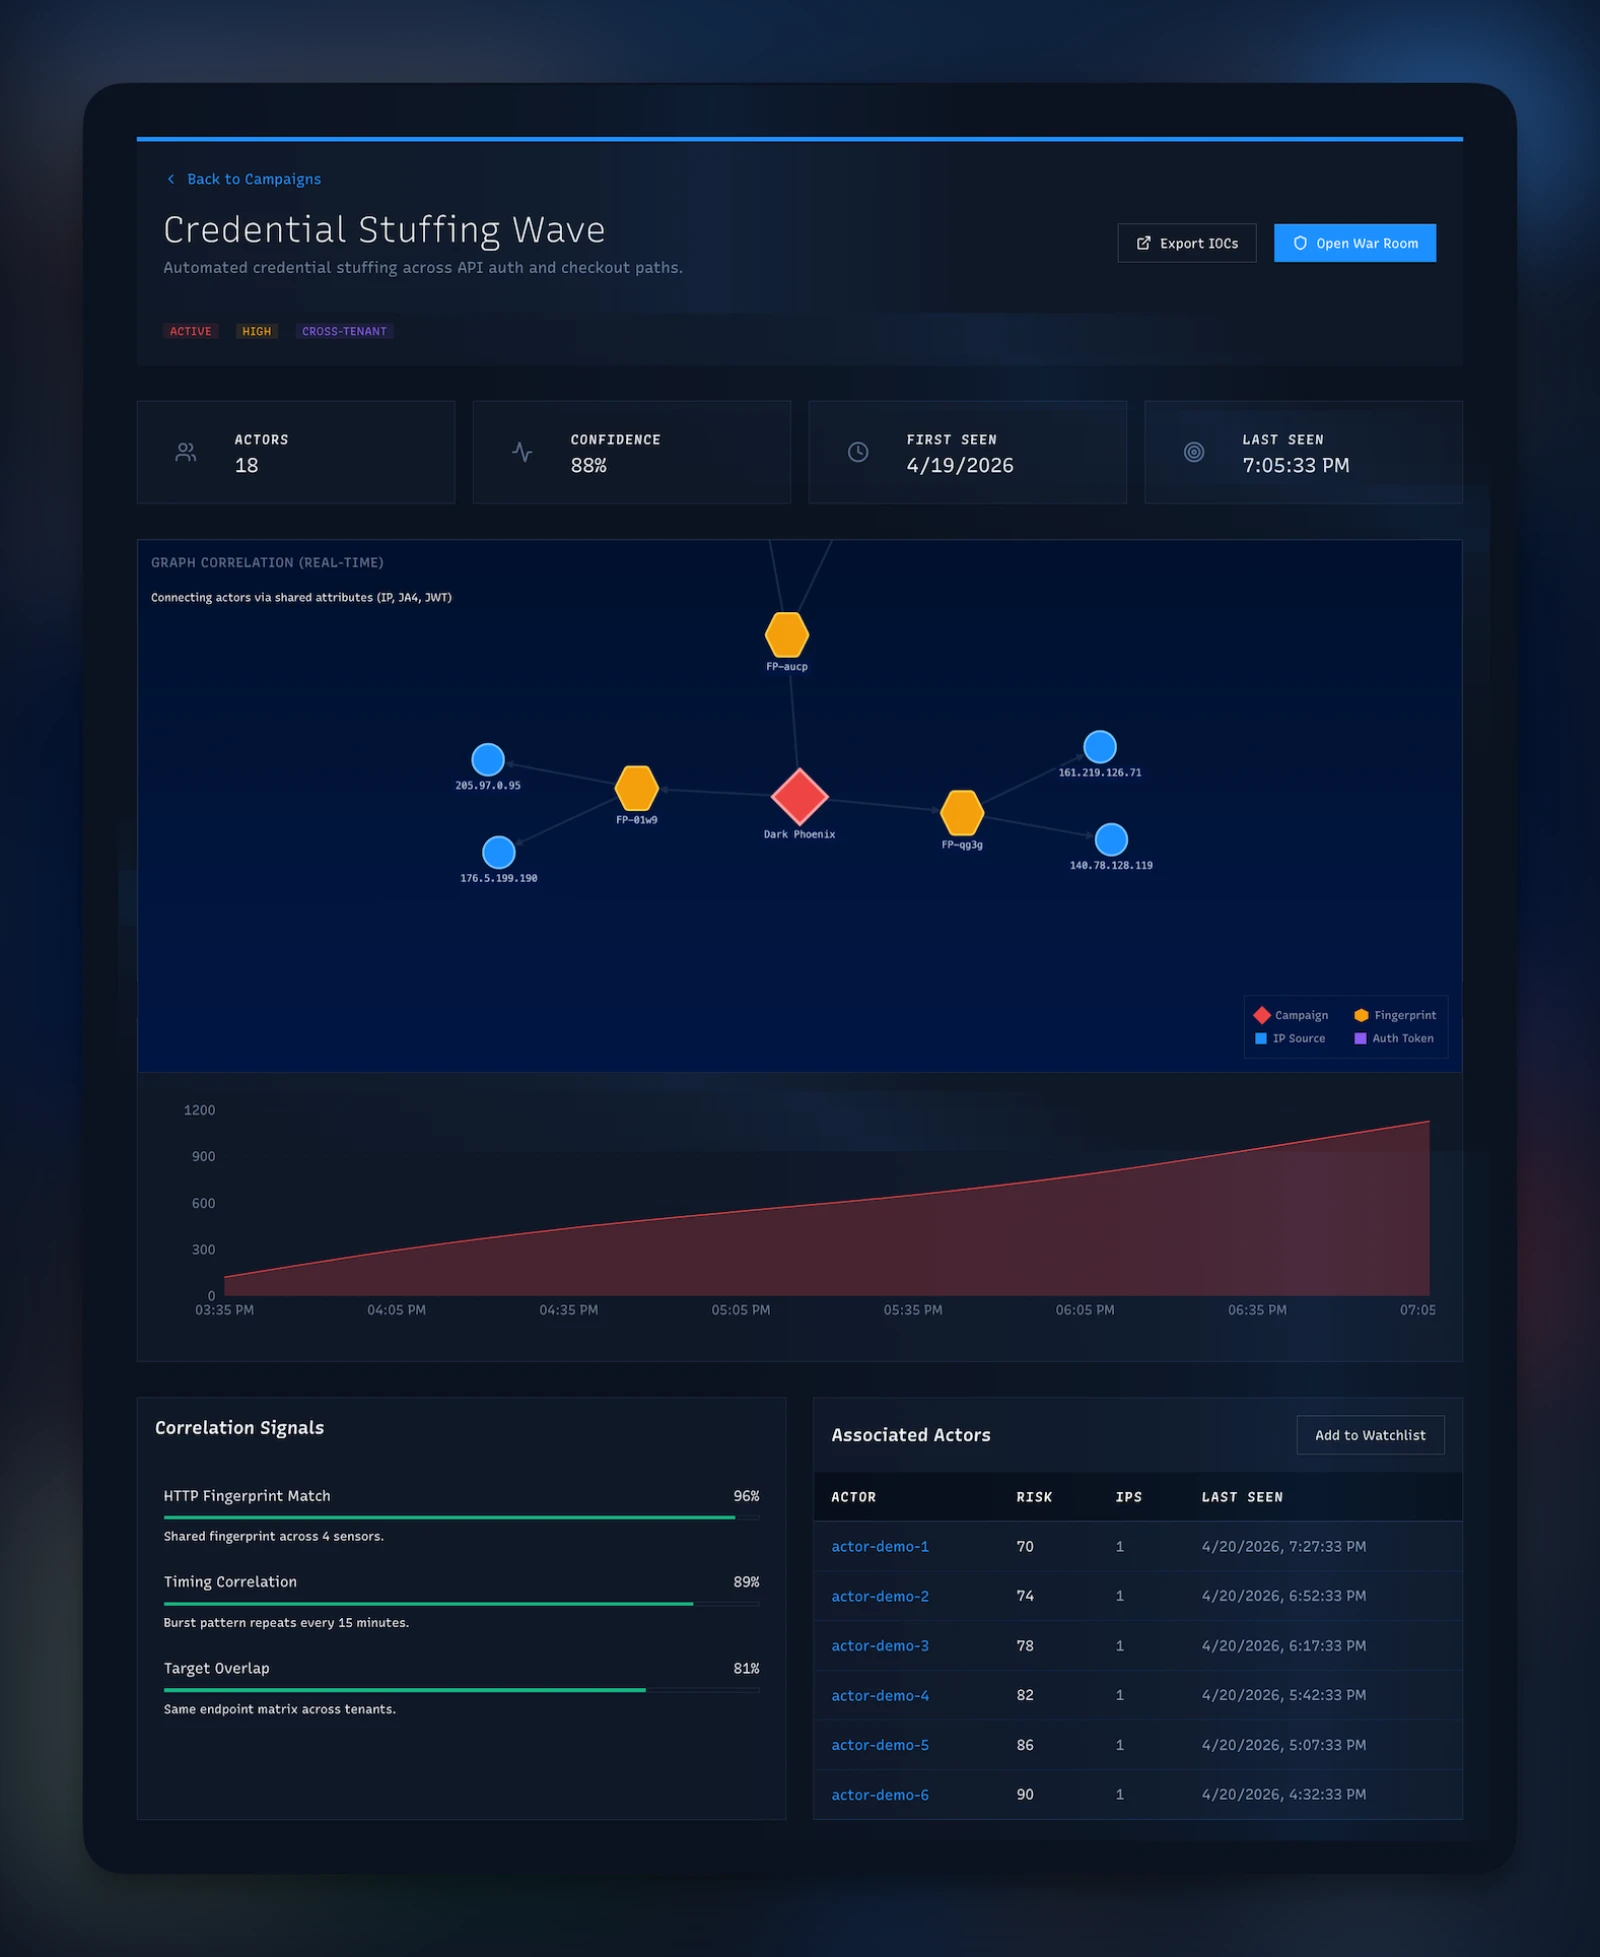
- Campaign Map. Interactive graph — IPs, JA4 tokens, ASNs, credentials, and the edges between them. Start from any node and walk second- and third-degree relationships.
- Config Manager. Version-controlled sensor configuration, diff and rollback, schema-validated YAML push to the fleet. Pushing rulesets is a UI action, not a CI pipeline.
- Rule Distributor. Staged rollout: immediate, canary to N% of the fleet, scheduled. Per-sensor sync state is tracked and acked. Rollback is the same mechanism in reverse.
- Fleet Commander. Send arbitrary commands to sensors — block an IP, restart a worker, toggle a feature — over WebSocket with a 10-second timeout and three retries. Ack status persisted.
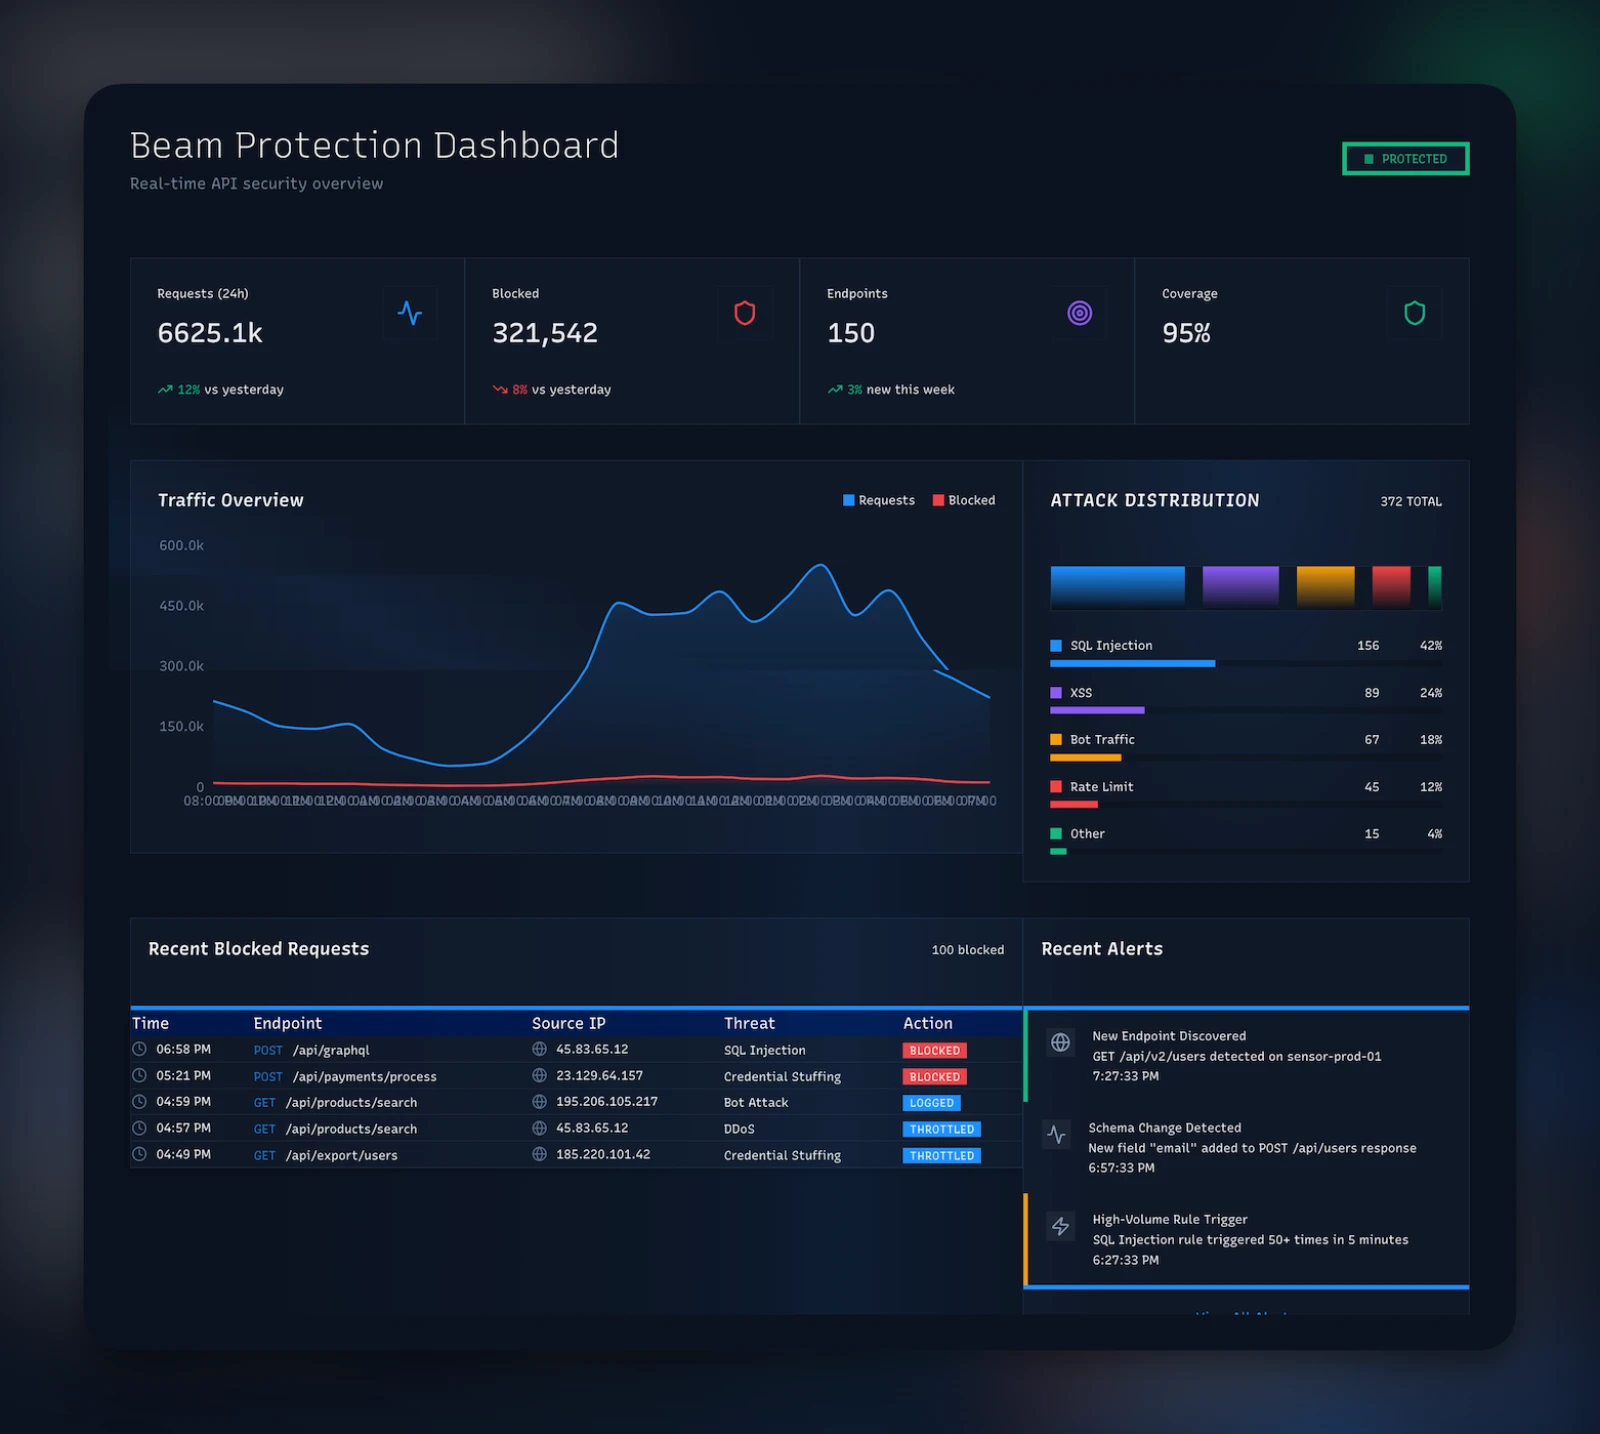
- API Catalog. Fleet-wide aggregated view of discovered endpoints, learned schemas, traffic per endpoint. One sensor's new parameter shape gets correlated with every sensor's view of the same route.
- Hunt API. Sigma rules and custom SQL across fleet history, with automatic time-window routing between PostgreSQL (<24h) and ClickHouse (>24h). Saved queries, scheduled hunts, graph-traversal queries.
- War Room. Incident collaboration with live timeline, real-time metrics, quick-actions (block IP/fingerprint/ASN), team chat, and playbook triggers. Where a verified campaign becomes a fleet-wide rule push.
- Impossible Travel. Detects credential compromise by tracking user-session geography across sensors. Same identity in New York and Jakarta within 90 minutes = high-severity signal.
- Security Dashboard. Fleet-wide protection metrics — total RPS, block rate, threat level, sensors healthy, active campaigns — in one operator pane.
The README's self-description is "Netdata Cloud meets CrowdStrike Falcon for edge security." I wrote that line a long time ago and I haven't found a better one. Netdata for the fleet-health credibility. Falcon for the security-product-at-scale credibility. This is both.
Now the architectural argument.
Collective defense, without centralizing data
Here's the thing a lot of managed edge-WAF offerings don't want you to think about.
In the standard design, when your sensor sees a SQL-injection payload, it sends that payload to a central service for correlation. The service sees the raw string. Sees the URL it targeted. Sees the headers, probably. Because correlation — in the naive model — requires comparing things, and comparing things requires seeing them.
Now extend that to thirty tenants sharing a platform. Tenant A's sensor sees an attempted credential stuff against their login flow. Tenant B's sensor sees the same pattern. The central service correlates them — good! Tenants A and B are now defended collectively. But the central service also saw both sets of login payloads. Both sets of URL paths. Both sets of timing fingerprints. Both tenants' traffic has flowed through a shared correlation boundary that neither of them directly authorized.
For an enterprise with regulated data, this is a non-starter disguised as a value-add. "Collective defense" starts sounding like "centralized liability" very fast.
Synapse Fleet Intelligence solves this with a specific architectural
choice. The sensor doesn't send the payload. It sends a SHA-256 hash
of (tenantId, payload-feature-vector). The Correlator
groups signals by the hash, detects if two or more tenants
emit the same hash within a correlation window, and creates a
fleet-wide campaign record with tenantId = null. The
campaign exists. Its constituent attacks are still scoped to their
tenants. The central service never saw the payload.
Under the hood, the Correlator runs eight correlation factors simultaneously. Payload clustering (does the hash match?). Temporal proximity (within the same window?). Actor hashes (same hashed identity?). Fingerprint matching (same JA4/JA4H signature across tenants?). Geographic clustering (same country cone?). Graph relationships (traversable from known-bad infrastructure?). JA4 token matching (TLS handshake identity?). ASN overlap (same network origin?). A campaign fires when enough factors align across enough tenants.
Once a campaign is confirmed, the mitigation path is where the fleet
earns its keep. The Broadcaster auto-creates blocklist entries — IP,
fingerprint, ASN, whatever the campaign identified — in the
blocklist table with tenantId = null,
meaning "apply to everyone." BullMQ queues the update. The
dashboard-gateway pushes it over WebSocket to every connected
sensor. The documented target latency is under 100 milliseconds end
to end. The observed median is closer to 50.
Every sensor receiving that push updates its in-memory blocklist cache (100K entries, configurable) and starts blocking the bad infrastructure on the next request. No tenant ever saw another tenant's traffic. No raw payload ever left the sensor it landed on. The fleet learned.
There's a second loop that runs when a campaign is ambiguous. In the War Room, an operator can mark a candidate campaign as a verified threat. That triggers a staged playbook: generate the mitigation rule → push to a canary fleet (a small sample) → monitor for false positives → escalate to the full fleet if clean. The human makes the call; the automation runs the staged rollout.
And for threat hunters, the Graph API gives you something most SIEMs don't. Start from any node — an IP, a JA4 hash, an ASN — and traverse outward. The edges are relationships the correlator built from observed traffic: this IP used this JA4, this JA4 appeared against this tenant, these IPs share this ASN. You walk second- and third-degree connections and find the infrastructure the attacker didn't mean to expose. In practice this turns ten minutes of "check each IOC manually" into a thirty-second click-through.
This is the section I wanted to write first, because it's the section most vendors don't.
Real-time analytics for the SOC
The fleet's storage stack is a three-tier split, and the split matters operationally.
tenantId foreign key.
This tier is where you look for state, not trends. The Hunt API reads from this stack with time-window routing built in. Queries over the last 24 hours go to PostgreSQL. Older queries route to ClickHouse. The SOC analyst doesn't have to know which store they're querying — they write Sigma or SQL and get results. Scheduled hunts run on an hourly cadence against the archival tier.
Impossible Travel is the simplest illustration of what this architecture unlocks. Each authenticated session carries a hashed identity across sensors. The detector maintains recent login locations per identity in Redis, and when the same identity lands on a new geo-distant sensor faster than commercial air travel would allow, the fleet fires a high-severity signal. From one sensor's view, a login from Jakarta looks like any other login. From the fleet's view, it's a credential-compromise indicator — because the same identity was authenticated from New York ninety minutes earlier.
That detection is literally not possible at the sensor level. It's the fleet's job.
The retention defaults, since enterprise buyers always ask: traffic metrics at 1-minute resolution for 90 days. Security events at raw-event fidelity for a year. Health metrics for 30 days. API endpoint stats, schema violations, and discovery records for 90 days. All tunable; those are the defaults that make the sizing math work without an appliance conversation.
Self-host or use ours
Fleet Intelligence ships three ways: a standalone Node artifact, an
npm package (@atlascrew/horizon), or a Docker
container. All three install on infrastructure you already own.
If you self-host, you run the hub, Postgres, optional ClickHouse, and Redis on your side of the boundary. Your sensors talk only to your hub. Your Fleet plane lives entirely inside your trust domain. You get the full product — every mechanism described in this article works identically whether you run the hub or we do. The Correlator, the War Room, the Hunt API, campaign detection, the fleet-wide push, the dashboards — running on your hardware.
What you give up by self-hosting is two specific things.
The first is convenience. Running a small stack (Postgres, a Node service, optional ClickHouse and Redis) is yours now — along with updates, certificate rotation, backup, and whatever monitoring conventions your infrastructure already has. It's not onerous — the standalone bundle covers most of the operational edges — but it's nonzero.
The second is global collective defense, and this is the one most regulated buyers underweight on the first pass.
The cross-tenant correlation inside your self-hosted fleet sees the attacks that hit your sensors. If you have thirty sensors across ten business units or tenant environments, the hub correlates across all thirty. Everything in the Collective Defense section above still applies: SHA-256 hashes, eight-factor correlation, ~50ms fleet-wide pushes, the whole pipeline. You still get collective defense inside your datacenters.
What a self-hosted deployment can't see is attacks hitting anyone else's deployment. The Atlas Crew managed instance adds a second correlation tier on top of the per-deployment one: signals that fingerprint out of individual customers' private fleets can optionally participate in a global threat feed. If an attacker runs the same new campaign against three unrelated companies in the same industry, the global tier sees the pattern earlier than any one private deployment would — potentially by the time the third attack lands instead of the thirtieth.
That global tier is the only thing self-hosting doesn't give you. Everything else — privacy properties, APIs, dashboards, correlation factors — runs in your own datacenter when you want it to.
Self-hosting also covers the most restrictive deployment case: air-gapped datacenters. Put the hub inside the boundary, point your sensors at it, and the entire Fleet plane lives behind whatever network perimeter your compliance posture requires. The sensors still get cross-tenant correlation across every sensor inside that boundary. Collective defense works. The ~50ms push still happens. The eight-factor correlator still runs. The only thing an air-gapped deployment gives up is the global intel feed — and for most air-gap customers, not being on the global feed is the point.
For most enterprises the decision is straightforward. Regulated data, strict CISO review, internal-only posture? Self-host. The product stays intact. Your data stays inside. Want the global-intel advantage and willing to trade for managed convenience? Use our instance. Either way, the sensors don't know the difference. They talk to a hub over WebSocket. The hub is yours or ours. The trust boundary is drawn wherever you want it.
See the deployment topology →When a sensor can't reach the hub
Every enterprise architect asks this next: what happens when a sensor loses its connection to the hub?
Not "what happens if you're air-gapped" — that's a deployment choice, covered above. I mean the network partition case: the hub is momentarily unreachable, a sensor's WebSocket drops, the fleet telemetry feed goes quiet. This is the resilience question, and it's the same question whether the hub is on-prem or managed.
When a sensor loses contact with Fleet Intelligence, it doesn't fail open. It doesn't degrade. It keeps doing exactly what it was already doing, with the configuration and the blocklist and the behavioral baseline it had at the moment the link dropped. The sensor was already a complete detection engine. The fleet adds context; it doesn't replace evaluation.
What the sensor keeps doing without the hub: all local rule evaluation, behavioral scoring, schema-learned detection, DLP, fingerprinting, session tracking, credential-stuffing correlation within its own view, bot detection, interrogator challenges, rate limiting, and every existing blocklist entry it has cached. None of this calls anything outside the pod.
What it loses while disconnected: new cross-tenant campaign updates (it operates off its last-synced blocklist), brand-new IOCs from other sensors in the fleet, hot-reloads of config changes pushed from the hub, rule distribution updates, and the ability to be remotely commanded. Staleness on the blocklist — the biggest worry — is usually measured in tens of minutes before an operator notices a sensor has drifted, and the last-synced state typically covers the active campaigns.
The reconnect path is standard exponential backoff: 1s, 2s, 4s, 8s, capped at 30s. When the sensor gets back online it syncs the blocklist delta, picks up any new rules, and re-registers its heartbeat. No manual intervention required.
This is the sensor-side resilience story, and it applies uniformly. Whether you're running the hub yourself or on the managed instance, whether your sensors live in the same datacenter as the hub or across a continent, the failure behavior is the same: sensors keep enforcing, reconnect when they can, never silently fail open.
One fleet, many tenants, no shared traffic
If I had to compress the architectural thesis into one line for an enterprise buyer, it would be this: your sensors share what they learned, not what they saw.
That's the discipline that makes collective defense something you can take through a security review without flinching. The fleet makes thirty or three hundred sensors act like one coherent system. The privacy model is what keeps that safe.
Fleet Intelligence is what you deploy when you've accepted the single-sensor-is-a-brain thesis and your next question is how to run many of them without losing either the autonomy or the trust boundary. It's the coordination layer that doesn't compromise either one.
It's also the answer to a question I should have let enterprise architects ask me earlier. "What do you do for coordination?" is not a product-category question. It's a trust-boundary question. Most of my peers in this market will answer the product-category version. I'd rather answer the one that actually gets asked in the compliance review.
Every sensor is a brain. A fleet that shares fingerprints, not data, is how a room full of them becomes intelligent.
The companion article, Every sensor is a brain, makes the single-sensor case that this piece builds on. Line-rate DLP covers one capability that runs inline on every request. For the visual set: the Platform Architecture infographic shows the sensor and fleet planes in one view, Campaign Correlation Engine walks through the correlator, Threat Intel Feedback Loop traces the collective-defense path end to end, Fleet Telemetry Pipeline shows how signals move from sensor to hub, and Analyst Incident Workflow covers the War Room and playbook flow. Or browse all writing.